

November 2021 – Volume 25, Number 3
Maria Belen Buttiler
Michigan State University, USA
<buttiler![]() msu.edu>
msu.edu>
Abstract
In this study, I investigate whether three A2 Key for Schools practice tests from Cambridge Assessment English for 6th-graders (11-12 years old) in Argentina measure growth and produce scores that are meaningful. Drawing data from three consecutive years, I analyze the scores of 80 children over a school year and consider whether the tests are beneficial for both students and teachers in terms of time and instructional impact. In this English as a Foreign Language (EFL) context, the results show no significant differences among the students’ average performances across the Reading and Writing section of the practice tests and some significant differences across the Listening practice tests. I discuss the affective, pedagogical, and curricular implications and argue that because the tests are administered in tight succession, growth may be too small to measure. It is important for teachers and language program coordinators to ensure that the testing they do benefits instruction and positively impacts students in language classes. This is because testing should serve and inform instruction. In this study, I suggest how other teachers in charge of their elementary and middle school assessment programs can do similar analyses to ensure their students’ language evaluation programming is maximally beneficial.
Keywords: Language assessment, standardized tests, young learners, repeated testing
A popular saying states that “practice makes perfect”, meaning that it is possible to become proficient in an activity or a skill if one exercises regularly. It refers to the idea that the more someone practices, the more likely they are to excel. But how often does an apprentice need to practice in order to improve certain skills? How much do practice effects impact the students’ learning process? It is generally believed that the more exam practice foreign language learners do, the higher the chances of passing a test. Some researchers have pointed out that if students take the same or a similar exam more than once, they may obtain a higher score the second or third time, without necessarily showing improvement in the skills measured (Davies et al., 1999). In addition, as Green and Van Moere (2020) more recently claimed, language learners and instructors “may use repeated test taking as an opportunity to identify and exploit features of the test design with the intention of maximizing scores rather than improving target abilities” (p. 479). Therefore, repeated testing may not necessarily reflect an increase in language proficiency.
Many foreign language instructors and coordinators have their students take practice tests numerous times in preparation for standardized assessments such as Cambridge Assessment English tests. An increasing body of research has examined language testing in relation to young learners in English as a Foreign Language (EFL) contexts (Bailey, 2008; Butler, 2015, 2016, 2017; McKay, 2006; Menken, 2018; Molloy, 2015; Nikolov, 2016; Wolf & Butler, 2017; Wolf et al., 2008; Wolf & Farnsworth, 2014). However, there is little systematic research on the impact of repeated language testing and the effects of elapsed time between tests taken, especially in young learners (Cho & Blood, 2020; Green, 2005; Gu et al., 2015; Knoch et al., 2020; Lin & Chen, 2020). Even though repeated exam practice can be seen as preparatory and not analytical and students enrolled for an official exam may benefit from this practice, children may experience anxiety and frustration if the test scores do not show measurable progress. This is why it is important that practice is accompanied by opportunities for students to obtain useful feedback on their performance.
The purpose of this study is to investigate whether three A2 Key for Schools practice tests from Cambridge Assessment English for 6th-graders at a school in Argentina measure growth and produce scores that are meaningful. In this EFL context, the current study examines whether the three tests taken by three groups of students in May, June, and August of 2016, 2017, and 2018 are consequentially beneficial in terms of time, economics, and instructional impact. This study also aims at sharing simple statistical methods that EFL teachers and school administrators can use to chart their students’ test scores over a period of time and conduct item analysis for different parts of the tests.
In the context of this study, Cambridge proficiency tests are considered standardized assessments since they are administrated and scored in a consistent manner, using the answer keys and marking schemes provided by Cambridge Assessment English. The purpose of these in-class practice tests is to have students practice for the official test administered by Cambridge at the end of the school year, to track progress, and to measure outcomes. These exams consist of three different papers or assessments: Reading and Writing, Listening, and Speaking. This study will only focus on the first two. These assessments differ from multiple-choice exams in that they contain not only multiple-choice tasks but also gap fill, matching, open cloze, and guided writing tasks.
This study will address the following research questions:
- Do the three practice tests that students take throughout the school year (May, June, and August) measure growth?
- Are the three practice tests taken in preparation for the official test administration measuring progress effectively?
- Are all nine parts of the Reading and Writing assessment and all five parts of the Listening assessment measuring students’ skills effectively?
Literature Review
In the last few years, there has been a growing interest in assessing young learners’ English as a second or foreign language proficiency. Different standards-based tests (e.g., Cambridge Young Learners, TOEFL Primary, TOEFL Junior, Michigan Young Learners English, MET Go!, and PTE Young Learners) are used among elementary, middle, and high-school children around the world to measure English language proficiency, monitor students’ progress, and make decisions regarding placement, instructional planning, and promotion or retention, among others. Numerous ESL and EFL programs at schools and language centers have learners take similar tests repeatedly. Instructors and school administrators later use the test scores to inform students and their parents about the learners’ language abilities. However, little is known about the effects of repeated language testing and the need for staggered testing times using standardized tests, especially in young learners.
Previous research has mostly been conducted with adolescents and adult learners. Green (2005) analyzed writing scores for 15,380 test takers (ages 15 to 62) who took the official IELTS test twice. The period between tests ranged from 3 to 42 months. The researcher also focused on 476 students enrolled on ESL programs over periods of between three to ten weeks who took the IELTS writing test before and after the course. In this study, Green refuted the idea that 200 hours of instruction are needed to improve by one IELTS band score (as recommended by IELTS). Instead, he concluded that initial writing scores and region of origin proved to be stronger predictors of outcomes than course length. The author also noted a weak association between score gains and the period between tests. Barkaoui (2019) also examined the writing scores of adult EFL learners taking the Pearson Test of English (PTE) Academic multiple times. The scholar found that scores continued to rise for the first five months and then started to diminish. Overall, changes in writing scores over time were significantly associated with changes in test takers’ English language proficiency, but not with the number of times taking the tests or the interval between tests.
More recent studies investigated the effects of repeated test-taking and scores changes in the context of high-stakes English exams required for immigration purposes. Lin and Chen (2020) examined the writing performance of 562 students who took the Canadian English Language Proficiency Index Program–General (CELPIP–General) test at least three times, with a 30–40-day interval between the first and second attempts and a 90–180-day interval between the first and third attempts. The authors observed that the test scores were relatively stable over the 6-month period whereas lexical features were the most likely to improve even after one month. Knoch et al. (2020) investigated scores from participants who took the Pearson Test of English-Academic up to 22 times looking to satisfy Australian immigration requirements. Information obtained during interviews revealed that test takers changed their preparation approaches depending on their previous test results. Tests scores showed that the most meaningful improvements from one test session to the next were recorded on the speaking part of the test, followed by fewer improvements in the reading and listening sections. Writing had the fewest number of large improvements. Thus, studies carried out with adolescents and adult learners show that factors such as region of origin, writing scores, vocabulary skills, and speaking skills can be associated with changes in test takers’ language proficiency over time.
As pointed out before, research on the effects of repeated testing on young learners is scarce. In a longitudinal study, Gu et al. (2015) examined how the TOEFL Junior, a standardized English proficiency test for children ages 11-15, could be used to measure changes in language ability due to learning. The authors analyzed test scores from 4,606 students from 15 countries who took the test more than once. The findings suggested that the TOEFL Junior test serves to measure progress in young learners. The authors explained that students scored higher in the second test and that “the longer the interval between testing was, the greater the score gain was” (pp. 9-10). They argued that it does not seem possible that the observed gains were due to students having become more familiar with the test format the second time, which differs from Davies et al. (1999). Gu and colleagues stated that the test scores were higher due to changes in the target abilities (listening and reading) as a result of English language learning, which is consistent with Knoch et al.’s (2020) secondary findings. More recently, Cho and Blood (2020) investigated score change and analyzed the effects of elapsed time between tests taken by EFL learners in Japan and Turkey who took the TOEFL Primary, a test designed for students ages 8-13. In their study, the researchers found that rate of change varies depending on the initial scores obtained, test taker age, and test level difficulty, with a higher average performance for older students. To help explain why it may be difficult to measure score change across time, the authors also argued that young test takers have shorter attention spans and more developmental limitations than adults. Even though these studies looked at elapsed time between testing sessions, there was no reference to item analysis within the assessments. This can provide a more detailed insight into the students’ performance on the parts of the tests that require different language abilities.
Moreover, teachers and researchers have expressed their concerns about how children perceive and adapt to testing sessions. Based on the relationship between self-esteem, motivation, and assessment performance, some scholars have shown that it is highly important that young learners have positive experiences with assessments (McKay, 2006; Moss, 2013). Brumen and Cagran (2001) indicated that there is a strong positive correlation between the performance of young learners on assessments and their overall motivation. Research has also shown that affective factors can influence the performance of young learners more than they can impact the performance of adult test takers (Bachman & Palmer, 1996). In a study carried out in Turkey with students ages 9 to 13, Aydin (2012) found that learners experienced test anxiety related to time constraints, the physical setting, and difficulties in the comprehension of instructions. Cameron (2001) also pointed out the importance of clear instructions with young learners since their performance tends to vary depending on the clarity of the given activity. In relation to the type of task, Wolf and Butler (2017) stated that “it is important that sample tasks and practice tasks be available for young learners and their teachers” (p. 11). This highlights the significance of having students complete practice tasks focused on one test-target as well as practice testing in preparation for the official examinations. Finally, regarding score reporting, it has been suggested that assessment results for young learners should help students succeed (McKay, 2006). In this sense, students should have access to detailed and constructive feedback on their test performance, whereas teachers should be able to identify the learners’ strengths and areas in need of improvement to adopt strategies that will advance the students’ learning.
Context
The current study was carried out using practice test scores from 6th-graders studying at a bilingual school in Argentina. In this country, the educational system consists of six years of elementary school (for children ages 6 to 11, called Grades 1 to 6) and six years of high school (for children ages 12 to 17, called Years 1 to 6). At elementary school, students who attend classes at this institution have language, science, and drama lessons in English, which, on average, represent 40% of their total class time. At high school, because students must take more specific courses in Spanish, only 25% of the total curriculum is devoted to courses in English such as language, literature, and biology. For these content areas taught in English, the school follows a Content and Language Integrated Learning (CLIL) approach.
From Grade 3 in elementary school through the last year of high school, EFL teachers help students to prepare for the Cambridge Assessment English official exams. These language proficiency assessments follow the Common European Framework of Reference for Languages (CEFR) developed by the Council of Europe in 2001 to describe language ability on a six-point scale, from A1 (beginners) to C2 (advanced). Elementary Grades 3 to 5 receive training to take the Young Learners English Tests (YLE): Pre A1 Starters, A1 Movers, and A2 Flyers respectively. In the sixth and last year of elementary school, students take A2 Key for Schools, whereas in high school, learners prepare to take three higher level Cambridge Assessment English qualifications (PET, FCE, and CAE), equivalent to B1, B2, and C1 proficiency levels respectively. Taking the official tests at the end of the school year is not mandatory. Parents, however, are encouraged to pay the fees and have their children signed up. In preparation and, based on the assumption that parents will sign up their children for the official administration of the test on specific test dates (and normally 95% of elementary children take the test, but in high school approximately 70% do), all students receive equal training. In general, two to three hours per week are dedicated to exam practice in class and three practice tests are administered throughout the academic year with the stated goal that the more the students practice, the better they will do during the live administration of the test.
Because the school commits to following a CLIL approach to teach science and English language, teachers are required to use textbooks that present authentic, multicultural literature and language practice that promotes the development of higher-order thinking skills. At the same time, in English language classes, students use textbooks designed for EFL learners taking international language proficiency exams. These textbooks usually have a strong focus on forms, as they present grammar and vocabulary exercises where students are instructed to fill in gaps and answer multiple-choice questions. These activities serve as practice tasks and complement the practice done during exam practice hours.
Teachers’ attitudes towards the coexistence of this CLIL approach and the exam practice approach adopted in language classes generally indicate that there does not seem to be a convergence between these two methods of instruction. While focus on specific forms is not the objective of the CLIL classes, exam practice hours are mainly about explicit instruction of grammar rules and practice of individual structures. Indeed, Nikolov (2016) pointed out that “research projects on early CLIL tend to follow a different tradition unrelated to testing children or standards-based testing” (p. 8). Moreover, Turner (2012) argued that “teachers continue to grapple with the relationship between what they are doing in the classroom and the specifications of the external large-scale tests their students will eventually need to take” (p. 69). In addition, a study carried out by Hill (2015), showed that the integration of instruction, the curricula, and assessment can lead to more effective teaching practices and better assessment results with positive washback effects. Therefore, a more integrated approach where the exam practice hours also focus on meaning and CLIL classes assist students in strengthening certain language forms could enhance students’ learning and contribute to their performance on the test.
Motivations Behind the Current Study
I was motivated to conduct this study both as a practitioner who saw the need to investigate the three research questions in my own school’s context, and as a researcher in the field of applied linguistics. Whether multiple tests are beneficial and meaningful is an important question for me and the school students locally, and for the field of applied linguistics at large. The motivations behind this study relate to concerns that I had during my experience at this bilingual school regarding students’ performances on three practice tests and the affective, pedagogical, and curricular implications of this approach and teaching practice.
First, the time span between each of the three practice tests that students take ranges from thirty to forty-five days, with a three-month interval between the first and the third practice test. The students usually take the first test by mid-May, the second one in June, and the third and last practice test in August. Because the school year begins in March, students do the first practice test less than two months after the beginning of classes, a period that is usually not enough for teachers to present the different test items and for students to become familiar with the overall test structure and its parts. In addition, the last practice test is administered right after the two-week winter break, a time during which students do not usually do English homework or receive much exposure to the target language. As discussed above, in some contexts, test scores may be relatively stable over short time intervals, especially for reading, listening, and writing skills (Gu et al., 2015; Green, 2005; Knoch et al., 2020; Lin & Chen, 2020).
Second, the learners are told that the scores will not influence their grades because the tests are taken for the sake of practice. However, when they are handed out the assessments, students are asked to sit individually, and instructed not to speak, ask any questions, or use dictionaries. This, from my experience, increases the children’s anxiety and does not mirror their learning experiences where students are encouraged to participate, interact with their teachers and classmates, and resort to their notes and books when they need help. As indicated by Kormos et al. (2020), to ensure the validity of the interpretation of the scores, “assessment tasks should be administered in an environment that is familiar and comfortable for young learners” (p. 56). Hamid and Hoang (2018) highlighted the importance of “humanizing” language testing. They showed that test takers are calling for more friendly and closer-to-life tests to make the test-taking experience less stressful. Previous research also indicated that affective factors such as motivation, attitudes towards the test, and self-esteem influence a learner’s assessment performance, especially in young students (Bachman & Palmer, 1996, 2010). Therefore, the test administration conditions are important to investigate, as they can influence the students’ performance.
Further studies have shown that there exists a strong correlation between young learners’ performance on a test and their overall motivation (Brumen & Cagran, 2011). This relates to my third concern. Often times, when students get their graded tests back, they express that they see no significant differences among the first, second, and third practice tests scores. This usually leads to frustration and lack of motivation, making students feel that they are not making progress and that they will not be advised to take the official test. In addition, the students receive little and very general feedback on their performance on the practice tests. Not much time is devoted to specific and developmental feedback on different items of the test other than the corrections made by the teachers on the practice papers. These corrections may be somewhat helpful in the Reading and Writing assessments but may have very little value particularly in the Listening assessments as students do not listen to the audio tracks again to discuss the answers.
Fourth, as proof that they have seen their children’s tests and scores, parents are required to sign the practice tests and return them to the school. From my experience with interviews with parents, they sometimes expect that their children show considerable progress in a short period of time. According to Nikolov (2016), “parents who want their children to get language certificates assume that the proficiency achieved at an early stage of language learning will be automatically maintained and built on over time” (p. 3). Thus, the practice tests impact entire families and how the children are seen by their parents. In this sense, the practice tests may be causing unnecessary “parental worry” (Chik & Besser, 2011, p. 88) because the scores are not indicating significant growth or, in some cases, any growth at all. The worry may be unfounded because, when the tests are administered in tight succession, growth may be too small to measure. In addition, some parents who received the scores may worry not only that their children are not learning, but also that the teachers are not teaching. Concomitantly, the teachers who receive the scores may believe their teaching is not effective, but may not be sure why, which may demotivate them as educators.
Finally, because there are approximately thirty students in each classroom and one instructor may teach more than one course, grading these practice tests represents a significant workload. This may have a high opportunity cost as teachers spend several hours and even days grading tests and therefore cannot dedicate that time to activities such as lesson planning or material design that could make their classes more enriching for students. A possible solution to this could be to have students self-correct the closed answer sections of their tests in class. Students are used to this self-correction practice as they do it for other grammar and textbook exercises. That way, teachers could go over different parts of the test, providing students with an opportunity to learn about their correct and incorrect answers, and saving out-of-school grading time.
The Study
Participants and data collection
In this study, I analyzed practice test scores from elementary Grade 6 children (ages 11 and 12) who took A2 Key for Schools level practice tests three times during their elementary Grade 6 academic year: first in May, then in June, and finally in August. Each child thus took three Reading and Writing and three Listening A2 Key for Schools assessments. There were 80 children total in the study sample. The school is relatively small. There are approximately 25 to 30 students in elementary Grade 6 each year. Therefore, I was able to have 80 children in the sample by collapsing data from three consecutive years of Grade 6 practice test administration. These three years were 2016 (N= 25), 2017 (N= 26), and 2018 (N= 29).
The participants’ first language is Spanish. They attend an all-girls bilingual school in the province of Buenos Aires, Argentina. In previous years (Grades 3 to 5), all students received training in standards-based testing and most of them took Cambridge Assessment English tests designed for young learners (Pre A1 Starters, A1 Movers, A2 Flyers). Hence, in Grade 6 the students were familiar with the format of some standardized tests already.
Materials
For the current study, I analyzed the Reading and Writing and Listening scores obtained from the administration of three A2 Key for School Cambridge English practice tests over three consecutive years (2016, 2017, and 2018). These tests were taken from the first edition of Cambridge Key English Test for Schools 1 (2010), a book containing a set of past official examination papers from University of Cambridge ESOL and published by Cambridge University Press. Because the data were not originally collected with the purpose of carrying out the current study, there is no information as to whether all groups of students took the exact same practice test for each of the different testing times every year. However, for the sake of practicality and valuing the data collected longitudinally, over a period of three years, I will assume that as standards-based assessments, the tests used are overall equated in terms of difficulty. Cambridge Assessment English reported a 0.95 reliability for the total test score and a 3.23 Standard Error of Measurement (SEM) for the A2 Key for Schools test (Cambridge Assessment English, 2021, Quality and accountability).
The Reading and Writing paper is a combination of multiple choice, multiple matching, open cloze, and guided writing tasks. The writing component requires students to write 25-35-word email or note to a friend usually making an invitation or describing an object. This paper is meant to be finished within one hour and 10 minutes and accounts for 50% of the total points of the test. Notice that the test format has recently changed and some information here may differ from the 2020 version of the exam. The Listening paper contains five parts that contain a total of 25 questions. Students are given 30 minutes to solve the activities while listening and transfer their answers to the answer sheet. This paper accounts for 25% of the total grade.
Analysis
I compiled and coded the data using Microsoft Excel 2010. I conducted one-way analyses of variance (ANOVAs) to see if there were any differences among the three testing times (practice tests I, II, and III) for both Reading and Writing and Listening assessments for all three groups (2016, 2017, 2018) combined and for all three groups separately. I also conducted post-ANOVA (post-hoc) independent-samples t tests to compare the students’ average performances in practice test I and II, practice test II and III, and practice test I and III for both Reading and Writing and Listening assessments.
Then, for all three groups combined, I did item analysis to calculate the average item facility (IF) and the average item difficulty (ID) for the upper performers and the lower performers to see which parts of the assessments discriminate more effectively. I decided that the cut-off point would be 80% of the total score of each individual assessment, meaning that students who scored 80% or more were considered high performers whereas students who scored 79% or less were considered lower performers. This is because in my school context, 80% of the total score is the perceived dividing line between good performance and performance that is weak or in need of practice. The decision also matches the A2 Key for Schools Scale Scores provided by Cambridge Assessment English according to which students with a performance equal to or higher than 80% will obtain an A2-level certification (Cambridge Assessment English, 2021, A2 Key for Schools. Results).
Results
An analysis of variance showed that there were no significant differences among the students’ average performances across the three Reading and Writing practice tests, F(2, 238) = 0.55, p = .57. Another analysis of variance showed that there were significant differences among the students’ average performances across the three Listening practice tests, F(2, 234) = 6.03, p = .002.
The post hoc t tests revealed that there were no significant differences between the Reading and Writing practice tests I (M = 0.68, SD = 0.15) and II (M = 0.70, SD = 0.14), t(160) = 0.18, p > .05 (1-tailed), d = 4.36, practice tests II (M = 0.70, SD = 0.14) and III (M = 0.70, SD = 0.14), t(159) = 0.49, , p > .05 (1-tailed), d = .003, and practice tests I (M = 0.68, SD =0.15) and III (M = 0.70, SD = 0.14), t(157) = 0.19, p > .05 (1-tailed), d =4.33.
Figure 1 below shows the average Reading and Writing scores for the three test sessions for all three groups of students (N = 80) combined, without year discrimination.
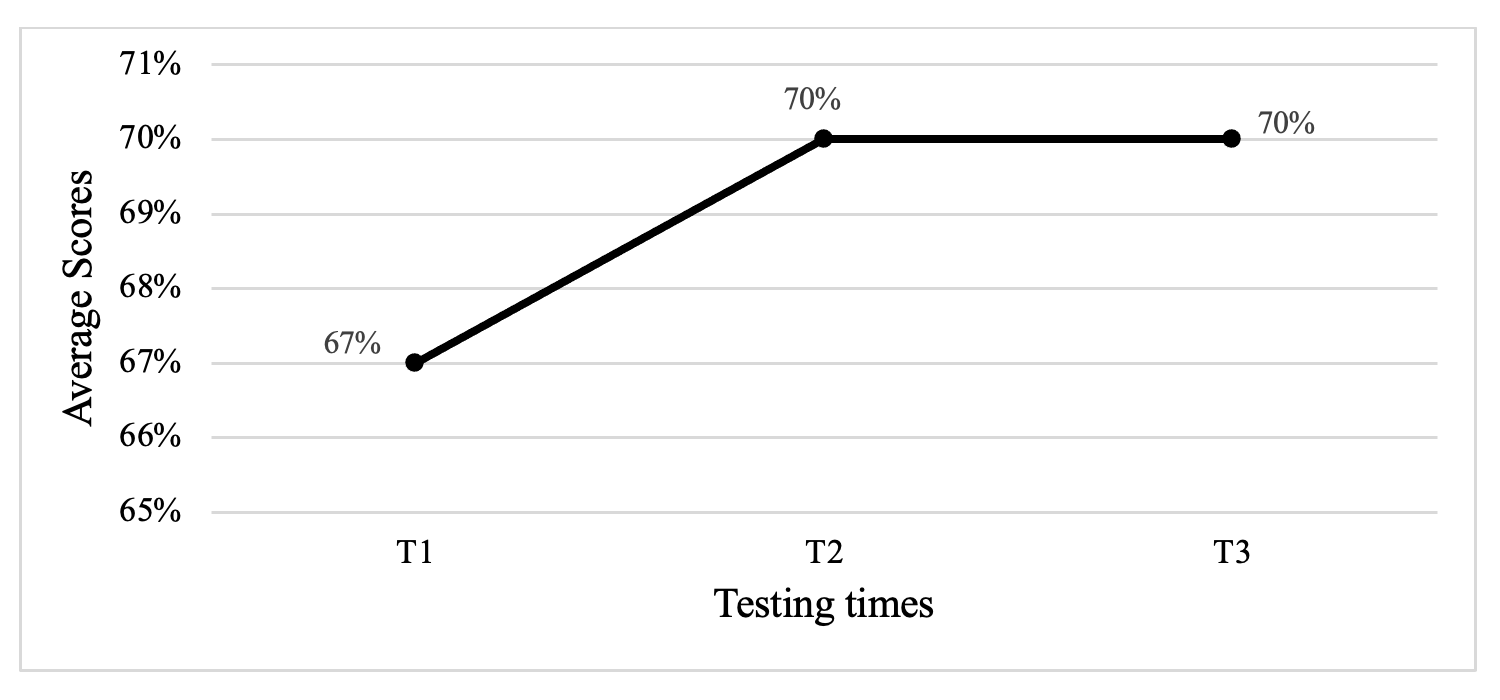
Figure 1. Average Reading and Writing scores for the three groups.
However, differences were found for some of the Listening assessments. Post hoc t-test results showed significant differences among the students’ average performances across practice tests I (M = 0.74, SD = 0.14) and II (M = 0.81, SD =0.15), t(156) = 0.00, p < .05 (1-tailed), d = .46, and tests I (M =0.74, SD =0.14) and III (M = 0.81, SD = 0.15), t(156) = 0.00, p < .05 (1-tailed), d =.50. No statistically significant differences were found between tests II (M = 0.81, SD = 0.15) and III (M = 0.81, SD = 0.15), t(156) = 0.39, p > .05 (1-tailed), d =.04.
Figure 2 below shows the average Listening scores for the three testing times for all three groups of students (N = 80) combined, without year discrimination.
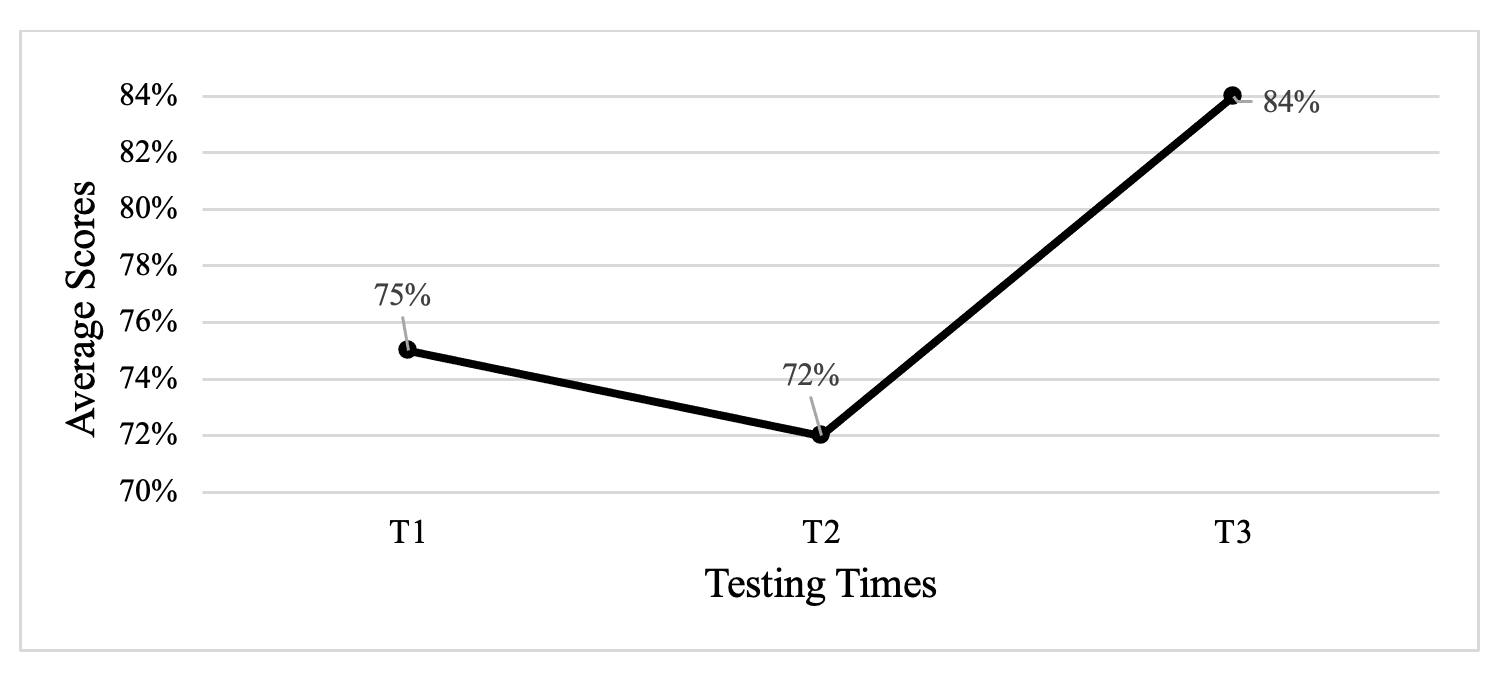
Figure 2. Average Listening scores for the three groups.
Even though the practice tests were taken from the same book of past official Cambridge Assessment papers, as mentioned above, there is no information as to whether the different groups of students (2016, 2017, 2018) took the exact same tests in May, June, and August. Therefore, the scores obtained by each group of students individually were also analyzed. This year-over-year measurement facilitates the cross-comparison of the three data sets obtained in 2016, 2017, and 2018. Figures 3 and 4 show the average Reading and Writing and Listening scores obtained per group of students each school year.
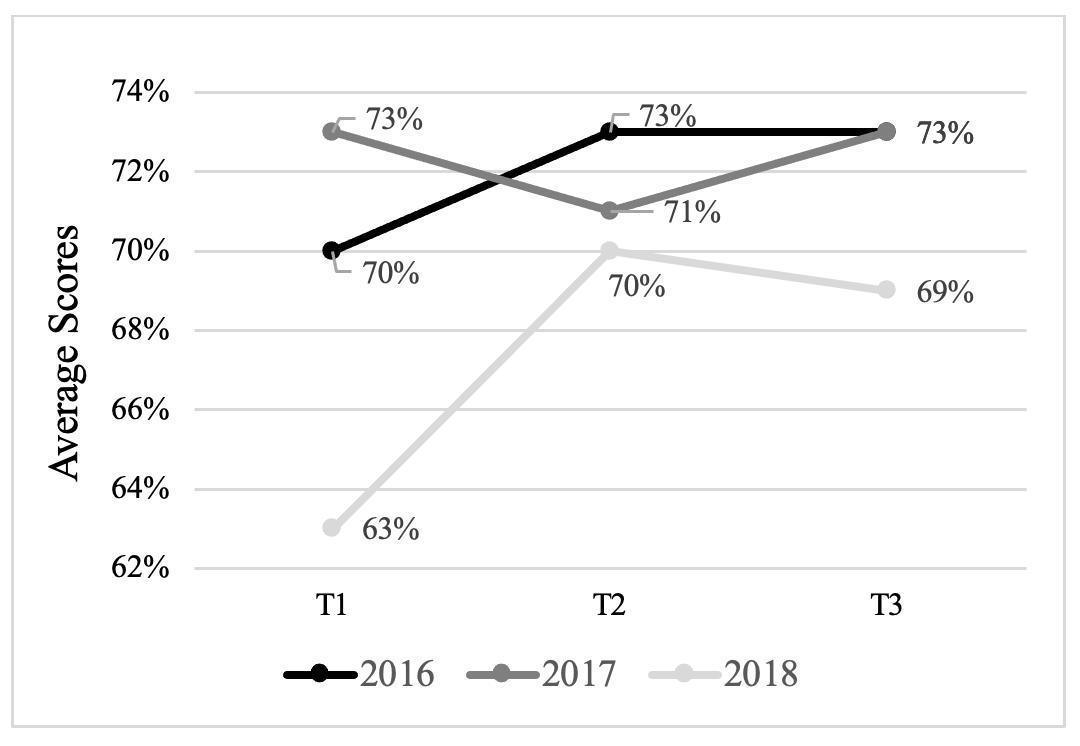
Figure 3. Average Reading and Writing scores per group obtained each year.
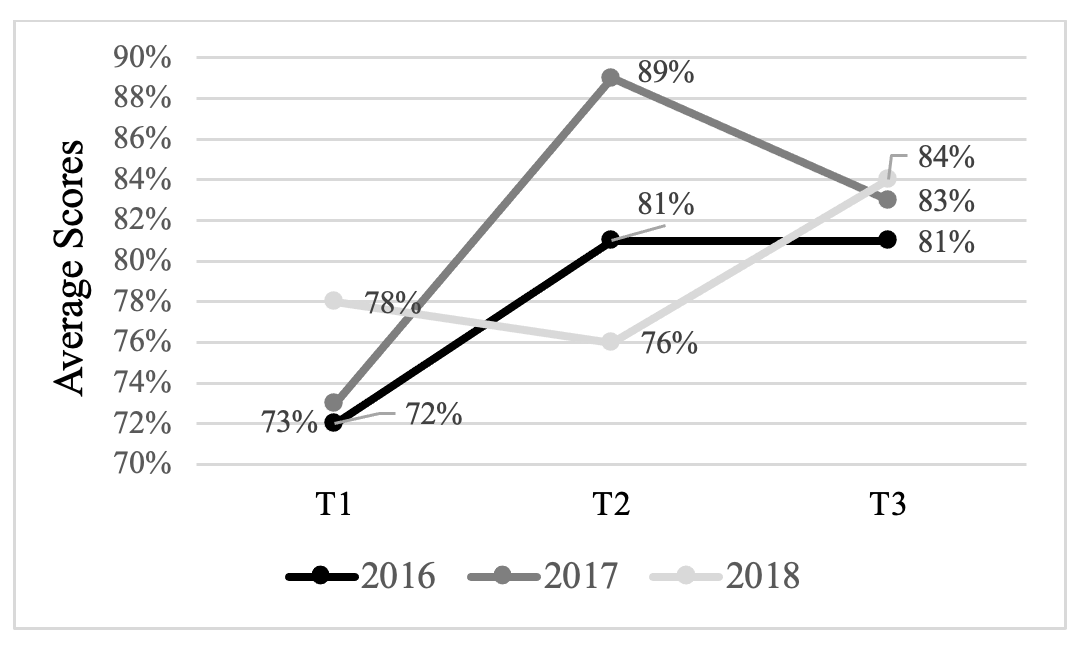
Figure 4. Average Listening scores per group obtained each year.
With regard to average IF and average ID for all three groups of students combined (N = 80), the results show that, on average, Parts 7 and 8 of the Reading and Writing assessments were the most difficult ones, whereas Parts 3, 6, and 9 seemed to be the least challenging ones for the majority of the students. This means that the open cloze and the guided writing tasks were more difficult than the multiple-choice ones.
For the Listening assessments, the results show that Parts 1, 2, and 3 contained the easiest items for the test takers in this study, whereas Parts 4 and 5 were the most difficult ones. This means that the students did better in multiple-choice tasks and gap fill tasks (where they had to identify key information listening to short dialogues or monologues) than they did in the multiple-choice tasks (where students had to identify the main idea, message, or topic) and the matching task (where students had to listen to a dialogue for key information and match five items).
Tables 1 and 2 below show the average numbers obtained in each part of the Reading and Writing and Listening assessments for each practice test (I, taken in May; II, taken in June; and III, taken in August) for the for all three groups of students combined.
Table 1. Average IF and average ID for the Reading and Writing assessments of 6th-graders in 2016, 2017, and 2018 (N = 80)
| Reading and Writing practice test I |
Reading and Writing practice test II |
Reading and Writing practice test III |
||||
| IF | ID | IF | ID | IF | ID | |
| Part 1 | 0.64 | 0.30 | 0.66 | 0.19 | 0.75 | 0.18 |
| Part 2 | 0.74 | 0.19 | 0.79 | 0.17 | 0.70 | 0.18 |
| Part 3 | 0.73 | 0.25 | 0.77 | 0.11 | 0.79 | 0.24 |
| Part 4 | 0.66 | 0.35 | 0.64 | 0.22 | 0.70 | 0.22 |
| Part 5 | 0.64 | 0.25 | 0.73 | 0.12 | 0.60 | 0.18 |
| Part 6 | 0.73 | 0.14 | 0.83 | 0.14 | 0.77 | 0.24 |
| Part 7 | 0.60 | 0.27 | 0.56 | 0.21 | 0.58 | 0.24 |
| Part 8 | 0.64 | 0.25 | 0.70 | 0.22 | 0.70 | 0.25 |
| Part 9 | 0.73 | 0.24 | 0.83 | 0.15 | 0.77 | 0.24 |
Table 2. Average IF and average ID for the Listening assessments of 6th-graders in 2016, 2017, and 2018 (N = 80)
| Listening practice test I | Listening practice test II | Listening practice test III | ||||
| IF | ID | IF | ID | IF | ID | |
| Part 1 | 0.80 | 0.22 | 0.87 | 0.09 | 0.85 | 0.19 |
| Part 2 | 0.78 | 0.16 | 0.91 | 0.16 | 0.81 | 0.37 |
| Part 3 | 0.71 | 0.24 | 0.78 | 0.41 | 0.84 | 0.23 |
| Part 4 | 0.62 | 0.29 | 0.69 | 0.47 | 0.74 | 0.27 |
| Part 5 | 0.71 | 0.27 | 0.69 | 0.41 | 0.69 | 0.26 |
Discussion
It is important for teachers and language program coordinators to ensure that the testing they do benefits instruction and positively impacts students in the language classes. This is because testing should serve and inform instruction. All stakeholders, including parents, should see clearly the benefits of assessment: as a way to chart growth, and as a way to demonstrate progress. Because students, teachers, and parents at this school were questioning the results of the tests, and the number of tests that the school was giving, I decided to conduct this study to look into the growing complaints and concerns.
Summary of the Answers to the Research Questions
The main question I addressed in this study was “Do the three practice tests that students take throughout the school year measure growth?” Overall, for the 6th-graders in this study, the results indicate that the Listening assessments seem to be more sensitive to growth than the Reading and Writing assessments. No statistically significant differences were found among the students’ Reading and Writing practice tests scores between the 45-day period or the 90-day period. For the Listening practice tests scores, significant growth was found between the 90-day interval, but not between the shorter 45-day testing intervals. Thus, no statistical differences mean no measurable growth in the Grade 6 children.
Regarding the second research question, “Are the three practice tests taken in preparation for the official test measuring progress effectively?”, the data show that, in general, the three testing sessions do not show much measurable change. These findings parallel those reported by Green (2005), Barkaoui (2019), and Lin and Chen (2020). As argued before, because the tests are administered in tight succession with not enough time for teachers to explain and for students to become familiar with the format, growth may be too small to measure. Isbell and colleagues (2019), who analyzed Oral Proficiency Interview Computer (OPIc) scores across four languages, also observed that many students had growth trajectories that were flat or even negative on four occasions over the course of two academic years. The authors explained that “there may have not been enough time and instruction” (p. 456) for students to show growth and register a change in the proficiency level. In the context of my study, without enough time for students to practice and for teachers to teach, progress cannot be measured effectively. As stated above, this may lead to student frustration, anxiety, and other undesired affective factors, in addition to parental worry.
The answer to the third and last research question “Are all nine parts of the Reading and Writing assessment and all five parts of the Listening assessment measuring students’ skills effectively?” can inform instruction. On average, the results show that some items of the test are less challenging than others. The benefits of an item analysis are twofold. First, identifying which parts of the assessments tend to be easier for students can provide teachers with a good starting point for presentation and practice. Teachers could devote the first exam practice sessions to the most accessible parts of the Reading and Writing and Listening assessments. This would probably avoid the initial frustration caused by having students do some of the most challenging parts at the beginning of the school year. Second, the item difficulty information could also allow the teachers to cover the more difficult items when students are more prepared to deal with further challenges as they grow in their language abilities.
In sum, the results of this study show no statistical differences in the students’ performance between the Reding and Writing testing times and the 45-day interval Listening testing times, confirming some of the students’ attitudes. Learners at this school would often look at their similar scores between tests and claim that they were not making much progress. This would frustrate them, especially if they had studied and practiced for the test in class and at home. The results of the study also confirm some parents’ concerns about their children not making enough progress as indicated by the graded exams. For these reasons, I suggest that less testing may be more economical and just as informative. For example, if only two practice tests (instead of three) were administered throughout the school year, this would allow for a longer time interval between the testing sessions and maybe more measurable growth.
The fact that students are taking practice tests so often does not allow them to show much progress and, therefore, they perceive no quantifiable learning growth, especially when it comes to reading and writing skills. Another possible explanation is that their young age may have an impact on their scores. Cho and Blood (2020) warned that “test scores of young test takers should be viewed with some caution because of their fleeting attention span and other developmental limitations that children have compared to adult test takers” (p. 519). Furthermore, Winke et al. (2017) investigated the cognitive validity of standardized English language tests with students ages 7 to 9. Through item analysis, the authors showed that native-English-speaking children found some items of the tests as challenging as English language learners. Therefore, looking into students’ performance on standardized and non-standardized tests with different time constraints and formats may provide a more holistic approach to measure their English language development.
Implications
Based on the statistical data obtained from this analysis and the frustration and worry generated among students and parents, I suggest that fewer testing times with a longer time in between may be helpful to allow for some measurable growth and progress in this teaching context. Given the lack of measurable progress shown in the three testing times, less testing might be more economical and as (or perhaps more) informative. This is reinforced by the results found by Gu et al. (2015) who, after looking at more than 4,000 TOEFL Junior tests scores, claimed that the longer the interval between the first and second administration of the test, the greater the score gain can be.
Consequently, the program could benefit from eliminating one testing session and having one practice test in early June and one practice test in late August, for example. By doing so, teachers can ensure that they will have enough time to introduce all nine parts of the Reading and Writing assessment and all five parts of the Listening assessment, and learners can become more familiar with the test format, its different parts, and the strategies required for each of them before the first practice test. From March, when the school year begins, though May teachers and students can utilize the materials they usually use in class such as textbooks, online platforms, and Cambridge English online activities for the CEFR A2 level. All of these can provide learners with useful tools for exam practice and allow them to gradually become familiar with grammatical structures and vocabulary items that are part of the test. As students work with materials designed for test takers, they will develop language abilities as well as exam strategies such as identifying the main idea of a paragraph or dialogue, understanding announcements, and writing short notes and invitations, among others.
Moreover, less testing might help students to reduce stress and anxiety. The three practice tests analyzed in this study are only some of the tests that 6th-graders take throughout the year. Thus, if learners can be exposed to fewer testing times with time constraints, they may save some test anxiety (Aydin, 2012). In addition, to create a more relaxed atmosphere, teachers and school administrators could avoid stressing the importance of excelling in the test (Malloy, 2015). Less testing might also be favorable for teachers as it would represent a release in the administrative burden. Grading tests can be very time-consuming, but if teachers had fewer tests to grade and tables to fill out, they could dedicate that time to focusing on other tasks that can ensure a more effective preparation of the children.
In relation to the Listening assessments, there are four possible explanations as to why students made some progress. First, listening seems to be more susceptible to practice effects than writing. This aligns with Knoch et al. (2020), but it does not match the findings by Gu et al. (2015) who observed fewer improvements in the listening part of the TOEFL Primary test and speculated that “limited exposure to aural input in English could have hindered listening skill development” (p. 9). The students in this study, however, are exposed to English 40% of their total class time, this is approximately 14 hours a week. Therefore, if amount of exposure and repeated practice are helping students to increase their overall scores, teachers could have students do more test-related listening practice in class, without claiming that they are “practice tests” to avoid some of the anxiety. To free teachers from taking home dozens of tests to grade, the class can self-check their assessments with the guidance of the teacher, which would also maximize opportunities for feedback. Second, research has shown that in EFL/ESL settings, comprehension skills (listening skills in particular) develop faster than productive skills in young EFL/ESL learners (Cameron, 2001; Malloy, 2015). Third, the listening score gains could also be due to students’ improving their listening skills in the target language. As Gu et al. (2017) argued, “observed test scores increases are due, at least in part, to real changes in the target ability as a result of English language learning” (p. 68). Fourth, because students are all different, an alternative or complementary explanation could be that the factors mentioned above combine to show progress.
Lastly, based on the data analyzed in relation to average IF and average ID, teachers could possibly reduce the number of test items that the students take at the beginning. In order to scaffold learners and foster confidence in them, teachers could have students take the easiest parts first, and the most challenging ones later in the school year during exam practice hours. Consequently, students would increase their confidence, feel more motivated, and hopefully perform better when the time comes. Yet, it is important to remember that, even if after applying the suggested changes students still do not show significant language growth, foreign language learning is a process that takes time.
Limitations
The findings of this study should be interpreted with caution given the following limitations. First, because the data were not originally collected with the intention of running a study, there is no information as to whether all groups of students took the exact same practice tests of equal difficulty for each of the different testing times in 2016, 2017, and 2018. Even though it was assumed that the tests are equated in terms of difficulty, it would be useful to have information that could verify that the three groups of students took tests of equal difficulty. This would increase the reliability of the results obtained. Second, accidentally, only the total scores of the last practice test (practice test III) of 2018 were saved, therefore there was missing data regarding the partial scores for this test. Third, a qualitative analysis would have added value to this study and helped to explain the results obtained. For example, interviews with teachers and students could have provided multiple perspectives and access to a deeper understanding of teachers’ and students’ attitudes towards the practice tests and their administration. Teachers’ voices could help to understand whether instruction time and exam practice hours are sufficient, how they feel about the grading workload, and whether they see potential benefits in having students take fewer tests with a longer time in between. Interviewing the students right after they took the exams would have also helped to explore their feelings and reactions to the tasks, the testing time constraints, and the directions provided, among other factors. Finally, the relatively small sample size of this study is not representative of other EFL young learner populations taking English proficiency standardized practice tests repeatedly. Despite these limitations, the study shows one approach to measuring growth among different testing times and doing item analysis to make more effective instructional decisions.
Conclusions
In this study, I investigated whether three standards-based practice tests of general English proficiency for 6th-graders measure growth and produce scores that are meaningful. I considered whether the tests are beneficial for both students and teachers in terms of time, affective factors, and instructional and curricular impact. Based on the test scores data and the students’ and teachers’ attitudes toward the practice test, I argued that the time span between the different testing times is not enough for students to show measurable progress. Second, I referred to the anxiety caused by the practice tests and how it might be limiting students’ performance. Third, I mentioned how student self-correction and more detailed teacher feedback may save time and be more effective. I also referred to how the tests scores impact not only young learners but also their families and the beliefs they have about their children’s progress.
The results show no significant differences among the students’ average performances across the Reading and Writing practice tests and some significant differences across the Listening practice tests. Drawing on the scores of the practice tests analyzed, the findings suggest that less testing may be more economical in terms of time, as informative, and more beneficial regarding students’ affective performance and teachers’ workload in this teaching context.
Even though repeated testing may allow students to gain some practice, and simulating the live exam conditions may be beneficial in experimental terms as students may know what to expect, it can also create anxiety and frustration among young children if no positive changes are perceived. The data suggest that three practice testing sessions might be detrimental to the program as neither students nor parents or teachers are able to see measurable growth throughout the school year. All in all, this exploratory practice allows me to argue that the practice tests should be used as tools for students to identify their strengths and weaknesses and for the teachers to adjust their instructional practices. Given the small sample size and the specific context, it is not the intention of this study to generalize the findings. Yet, the results reported are conclusive and can be used to inform programs that might be replicating this practice.
About the Author
Maria Belen Buttiler is a Ph.D. student in Education with emphasis on Language, Literacy, and Culture at the University of California, Davis. She holds a master’s degree in TESOL from Michigan State University and a bachelor’s degree in English Language and Literature from the National University of La Plata, Argentina. Maria Belen is an experienced EFL/ESL instructor whose research interests include bilingualism, L1/L2 literacy development, educational equity, assessment, and affective factors.
Acknowledgements
The author would like to thank Dr. Paula M. Winke for her invaluable guidance and support throughout the writing of this study.
To cite this article
Buttiler, M. B. (2021). Charting classroom growth: How often should we assess the English performance of 11 and 12-year-old children? Teaching English as a Second Language Electronic Journal (TESL-EJ), 25(3). https://tesl-ej.org/pdf/ej99/a3.pdf
References
Aydin, S. (2012). The effects of young EFL learners’ perceptions of tests on test anxiety. Education 3-13, 40(2), 189-204. https://www.doi.org/10.1080/03004279.2010.510119
Bachman, L. F. & Palmer, A. S. (1996). Language testing in practice: Designing and developing useful language tests. Oxford University Press.
Bailey, A. L. (2008). Assessing the language of young learners. In E. Shohamy & N. H. Hornberger (Eds.), Encyclopedia of language and education, Vol. 7: Language testing and assessment (pp. 379-398). Springer.
Barkaoui, K. (2019). Examining sources of variability in repeaters’ L2 writing scores: The case of the PTE Academic writing section. Language Testing, 36(1), 3-25. https://doi.org/10.1177/0265532217750692
Brumen, M. & Cagran, B. (2011). Teachers’ perspectives and practices in assessing young foreign language learners in three Eastern European countries. Education 3-13, 39(5), 541-559. https://doi.org/10.1080/03004279.2010.488243
Butler, Y. G. (2015). English language education among young learners in East Asia: A review of current research (2004-2014). Language Teaching, 48(3), 303-342. https://doi.org/10.1017/S0261444815000105
Butler, Y. G. (2016). Assessing young learners. In D. Tsagari & J. Banerjee (Eds.), Handbook of second language assessment (pp. 359-375). De Gruyter Mouton.
Butler, Y. G. (2017). Challenges and future directions for young learners’ English language assessments and validity research. In M.K. Wolf & Y. G: Butler (Eds.), English language proficiency assessments for young learners (pp. 255-273). Routledge.
Cambridge. (2021). Young Learners. https://www.cambridge.org/us/cambridgeenglish/official-exam-preparation-materials/exam/young-learners
Cambridge Assessment English. (2021). A1 Movers. https://www.cambridgeenglish.org/exams-and-tests/movers/
Cambridge Assessment English. (2021). A2 Flyers. https://www.cambridgeenglish.org/exams-and-tests/flyers/
Cambridge Assessment English. (2021). A2 Key for Schools. https://www.cambridgeenglish.org/exams-and-tests/key-for-schools/
Cambridge Assessment English. (2021). A2 Key for Schools. Results. https://www.cambridgeenglish.org/exams-and-tests/key-for-schools/results/
Cambridge Assessment English. (2021). B1 Preliminary. https://www.cambridgeenglish.org/exams-and-tests/preliminary/
Cambridge Assessment English. (2021). B2 First. https://www.cambridgeenglish.org/exams-and-tests/first/
Cambridge Assessment English. (2021). C1 Advanced. https://www.cambridgeenglish.org/exams-and-tests/
Cambridge Assessment English. (2021). Pre A1 Starters. https://www.cambridgeenglish.org/exams-and-tests/starters/
Cambridge Assessment English. (2021). Quality and accountability. https://www.cambridgeenglish.org/research-and-validation/quality-and-accountability/
Cambridge English. (2010). Key English Test for Schools 1. Cambridge University Press.
Cameron, L. (2001). Teaching languages to young learners. Cambridge University Press.
https://doi.org/10.1017/CBO9780511733109
Chik, A. & Besser, S (2011). International language test taking among young learners: A Hong Kong case study. Language Assessment Quarterly, 81(1), 73-91. https://doi.org/10.1080/15434303.2010.537417
Cho, Y. & Blood, I. A. (2020). An analysis of TOEFL® Primary™ repeaters: How much score change occurs? Language Testing, 37(4), 503-522. https://doi.org/10.1177/0265532220927751
Davies, A., Brown, A., Elder, C., Hill, K., Lumley, T., & McNamara, T. (1999). The dictionary of language testing. Cambridge University Press.
ETS TOEFL Junior. (2021). TOEFL Junior® Tests. https://www.ets.org/toefl_junior
ETS TOEFL Primary. (2021). The TOEFL Primary® Tests. https://www.ets.org/toefl_primary
Green, A. (2005). EAP study recommendations and score gains on the IELTS Academic Writing test. Assessing Writing, 10(1), 44-60. https://doi.org/10.1016/j.asw.2005.02.002
Green, A. & Van Moere, A. (2020). Repeated test-taking and longitudinal test score analysis. Language Testing, 37(4), 475-481. https://doi.org/10.1177/0265532220934202
Gu, L., Lockwood, J. R., & Powers, D. E. (2015). Evaluating the TOEFL Junior® standard test as a measure of progress for young English language learners. ETS Research Report Series, 2, 1-13. https://doi.org/10.1002/ets2.12064
Gu, L., Lockwood, J. R., & Powers, D. E. (2017). Making a validity argument for using the TOEFL Junior® standard test as a measure of progress for young English language learners. In M. K. Wolf & Y. G. Butler (Eds.), English language proficiency assessment for young learners (pp. 153-170). Routledge. https://doi.org/10.4324/9781315674391
Hamid, M. O. & Hoang, N. T. H. (2018). Humanising language testing. TESL-EJ, 22(1), 1-20. https://www.tesl-ej.org/wordpress/issues/volume22/ej85/ej85a5/
Hill, K. (2015). Integrating instruction, curricula, and assessments in the L2 classroom. TESL-EJ, 19(2), 1-22. http://www.tesl-ej.org/pdf/ej74/a1.pdf
Isbell, D., Winke, P., & Gass, S. (2019). Using the ACTFL OPIc to assess proficiency and monitor progress in a tertiary foreign languages program. Language Testing, 36(3), 439-465. https://doi.org/10.1177/0265532218798139
Knoch, U., Huisman, A. Elder, C., Kong, X., McKenna, A. (2020). Drawing on repeat test takers to study test preparation practices and their links to score gains. Language Testing, 37(4), 550-572. https://doi.org/10.1177/0265532220927407
Kormos, J., Brunfaut, T. & Michel, M. (2020). Motivational factors in computer-administered integrated skills tasks: A study of young learners. Language Assessment Quarterly, 17(1), 43-59. https://doi.org/10.1080/15434303.2019.1664551
Lin, Y-M. & Chen, M. Y. (2020). Understanding writing quality change: A longitudinal study of repeaters of a high-stakes standardized English proficiency test. Language Testing, 37(4), 523-549. https://doi.org/10.1177/0265532220925448
Malloy, A. (2015). Seven essential considerations for assessing young learners. Modern English Teacher, 24(1), 20-23. https://www.modernenglishteacher.com/media/5801/metjan15_malloy.pdf
McKay, P. (2006). Assessing young language learners. Cambridge University Press.
https://doi.org/10.1017/CBO9780511733093
Menken, K. (2018). English learners left behind: Standardized testing as language policy. Multilingual Matters.
Michigan Language Assessment. (2021). MET Go! https://michiganassessment.org/michigan-tests/met-go/met-go-details/
Michigan Language Assessment. (2021). The Michigan Young Learners English (MYLE). https://michiganassessment.org/michigan-tests/myle/
Moss, C. M. (2013). Research on classroom summative assessment. In J. H. McMillan (Ed.), SAGE handbook of research on classroom assessment (pp. 235-255). SAGE.
Nikolov, M. (2016). Assessing young learners of English: Global and local perspectives. Springer.
Pearson Qualifications. (2021). International Certificate Young Learners (PTE YL). https://qualifications.pearson.com/en/qualifications/international-certificate/young-learners.html
Turner, C. E. (2012). Classroom assessment. In G. Fulcher & F. Davidson (Eds.), The Routledge handbook of language testing (pp. 65-78). Routledge.
Winke, P., Lee, S., Ahn, J. I., Choi, I., Cui, Y., & Yoon, H. J. (2018). The cognitive validity of child English language tests: What young language learners and their native‐speaking peers can reveal. TESOL Quarterly, 52(2), 274-303. https://doi.org/10.1002/tesq.396
Wolf, M. K. & Butler, Y. B. (Eds.). (2017). English language proficiency assessment for young learners. Routledge.
Wolf, M. K. & Butler, Y. B. (2017). An overview of English language proficiency assessments for young learners. In M. K. Wolf & Y. G. Butler (Eds.), English language proficiency assessment for young learners (pp. 3-21). Routledge.
Wolf, M. K. & Fransworth, T. (2014). English language proficiency assessment as an exit criterion for language learners. In A. Kunan (Ed.), The companion to language assessment (pp. 303-317). John Wiley & Sons, Inc.
Wolf, M. K., Fransworth, T., & Herman, J. L. (2008). Validity issues in assessing English language learners’ language proficiency. Educational Assessment, 13(2), 80-107. http://www.doi.org/10.1080/10627190802394222
| Copyright rests with authors. Please cite TESL-EJ appropriately. Editor’s Note: The HTML version contains no page numbers. Please use the PDF version of this article for citations. |