

September 2012–Volume 16, Number 2
Shannon McCrocklin
Iowa State University, USA
<mccrockl![]() iastate.edu>
iastate.edu>
Abstract
Despite the growing use of media in the classroom, the effects of using of audio versus video in pronunciation teaching has been largely ignored. To analyze the impact of the use of audio or video training on aural discrimination of vowels, 61 participants (all students at a large American university) took a pre-test followed by two training sessions on a vowel contrast (/i/-/ɪ/). One group received audio training and the other group received video training. The groups then took a post-test and delayed post-test to determine the impact of the training. Students’ reactions to the two training types were also obtained through a questionnaire. Results showed that while both groups improved significantly from the pre-test to both post-tests, there was no statistically significant difference between the video and audio groups. Results show that reactions were more favorable to the video training.
Introduction
Due to increased use of media in language classrooms, it is important to consider what effects these technologies might have in terms of student performance, motivation, and attitude. While technology has been recognized as an important teaching tool for pronunciation, most of the emphasis has been on developing automatic speech recognition, visual feedback, and software use (for examples see Banafa, 2008; Engwall & Balter, 2007; Hincks & Edlund, 2009; Levis & Pickering, 2004; Neri, Cucchiarini, & Strik, 2008; Wang & Munro, 2004). However, the effects of incorporating audio versus video in the classroom have largely been ignored. This is problematic because audio and video materials are commonly used, whether through teacher-recorded materials, websites, podcasts, or even software programs, and incorporated into classes without knowing whether the two have different impacts. This research study aims to investigate the effects of using audio and video pronunciation training on perception of English vowels.
Review of the Literature
Numerous researchers have discussed the use of listening activities in improving pronunciation accuracy. For instance, MacCarthy (1976) described the process of second language learners “learning to listen” in the second language (L2):
It should be made clear at this point that “learning to listen” has nothing to do with improving the physical properties of anyone’s actual hearing mechanism: phrases such as “ to have a good ear for languages”, to “train” or “improve the ear”, refer to the ear in a metaphorical sense only. Aside from those individuals who are unfortunate enough to have truly defective hearing (most of whom will not even try to learn foreign languages, let alone teach them), it can be assumed that the actual hearing of the language learner is adequate to his task. What is required, though, is that he should learn to direct his attention to the auditory phenomena of the new language, and that he should do so in a way quite different from the way he listens to and understands his own language: through long training in the mother tongue (quite properly) get into the habit of noticing by and large only the parts that are relevant to catching the meaning, and of paying no attention to–literally not noticing–anything else. (p. 213)
For vowels in particular, learning to listen to English will often require that the student develop vowel categorizations appropriate for English. English vowels are distinguished by the following characteristics: tongue position and height within the oral cavity, lip rounding or spreading, tension, and gliding (vs. simple vowels). Length is not a distinguishing feature, but instead is influenced by the vowel’s environment (Celce-Murcia, Brinton, & Goodwin, 2010).
Research has supported the notion that sounds in an L2 are filtered through the phonological system of the first language (L1) (Beddor & Strange, 1982; Blankenship, 1991; Flege, Munro, & Fox, 1993). Filtering sounds through the L1 can lead an L2 learner to make distinctions that are inappropriate for the L2. English vowel pairings such as /i/ and /ɪ/, /e/ and /ε/, and /ε/ and /æ/ are likely to be problematic for learners, because vowels with similar articulatory positions are difficult to discriminate. Learning to listen to the L2 then will entail a redefining of the vowel space to better reflect the vowel distinctions of English. However, filtering through the L1 does not entirely explain the use of vowel errors for L2 learners. Bohn and Flege (1990) show that non-native speakers often rely on vowel length, even if they do not do so in their L1. Morrison (2008) explains this phenomenon by proposing that this use of length as a cue is a developmental stage, which may be based, at least in part, on the teaching of vowels as “long” and “short.” This means that learning appropriate vowel categories will also entail a shift from focusing on the length of the vowel to quality of the vowel (spectral cues).
Learning to create aural discrimination categories based on spectral cues is not only important for comprehension, but it is also likely to play a role in production. Researchers have found that practice in perception can affect and improve production (Bradlow, 1997; Rochet, 1995; Rvachew, 1994). Thus, instruction must help students listen for and produce the articulatory differences of vowels and lead them away from a reliance on vowel length. One way of achieving this goal is through the use of listening exercises that utilize minimal pairs. Celce-Murcia, Brinton, and Goodwin state, “Since vowels are often more easily distinguished in relation to one another than by any external standard of measurement, the perception of contrasts is an essential starting point in the teaching of vowels” (2010, p. 138). These vowel discrimination exercises will help students learn to listen for the subtle differences among the vowels and will help students shift from utilizing length as the main cue.
Two of the suggested activities using minimal pairs are “Same/Different” in which students hear two words and have to decide whether the two words are the same or different and “Which of the words is different?”, in which students would hear three or four words and decide which word in the string is different (Celce-Murcia et al., 2010, p. 140) All of these activities utilize minimal pairs, which in the case of /i/-/ɪ/ could include feet, fit; sleep, slip; and neat, knit. Other textbooks offer minimal pair activities such as giving the students a minimal pair and asking which word contains the specific, targeted vowel (Grant, 1993) or giving students a single word and asking them whether it includes the targeted vowel (Dalton & Seidlhofer, 1994). Celce-Murcia et al. (2010) also point out that in addition to helping students differentiate the vowels, these types of activities are likely to remind them that a single vowel mispronunciation can change the meaning of a word and lead to misunderstandings (p. 135). More importantly, research about the effectiveness of this type of training has shown that it leads to significant improvement in perception (Bradlow, Pisoni, Yamada, & Tohkura, 1997; Logan, Lively, & Pisoni, 1991; McClaskey, Pisoni, & Carell, 1983; Strange & Dittmann, 1984; Pisoni, Aslin, Perey, & Hennessey, 1982).
Although it seems clear that these activities are useful in developing appropriate vowel categories and increasing ability to discriminate vowels, there is more than one way to do these activities with students. Teachers can do these activities in class or they could assign the activities as video or audio files as homework. Because many schools do not offer separate pronunciation classes, many speaking and listening instructors have limited time to address pronunciation topics in the classroom. Assigning audio and video files as homework can make use of class time more efficient and effective. Understanding the differences between audio and video modes of training may also be useful to pronunciation software developers aiming to best meet the needs of their clients. Thus, it is important to evaluate the effects of the use of audio versus video in this type of training.
There is reason to believe that video would be a helpful addition to usual pronunciation teaching. Information processing theory suggests that by using both auditory and visual information a student is able to use dual-coding and access information through multiple routes (Bagui, 1998). A visual addition may also affect activation of auditory processing in the brain. It has been shown that a subject watching a person make speech-like mouth movements, even when there is no accompanying sound, is enough to activate the auditory cortex (Calvert et al., 1997). It has even been shown that the addition of visual cues can affect the sounds that listeners think they hear. MacDonald and McGurk (1978) studied the phenomenon that has come to be called the “McGurk Effect”, in which a woman’s head is video recorded and video and the audio do not match. Instead, the video shows the woman saying the syllable [ba], but the audio accompanying the visual is of the woman pronouncing [ga]. Normal viewers/listeners, in result, thought they heard [da]. These results show a heavy impact of visual cues in the processing of speech.
Early research in the effects of audio vs. video training with minimal pairs for discrimination of sounds has shown that video promotes increased acquisition. Hirata and Kelly (2010) examined the effects of training in Japanese vowel contrasts with 60 L1 English speaking participants, which are created by length differences. They conducted training through audio alone, audio plus the visual of the person speaking the words, and audio plus visual of the person speaking words and using hand gestures. Results show that the added visual of the person saying the words improved perception more than audio training alone. This study seems to be the only of its kind to examine the effects of audio vs. video training on vowel contrasts. Much of the other research concerning the effects of audio vs. video training focuses on the /r/ and /l/ contrast in English, which suggests that video training in English /r/ and /l/ improves perception more than audio training alone (Bradlow, Pisoni, Yamada, & Tohkura, 1997; Hardison, 2003; Hardison, 2005). This improvement in perception has also been shown to carry through to production (Hardison, 2003). All of these research studies have found evidence that video is a helpful addition in discrimination task training.
More research is necessary to examine whether using visual cues will aid or hinder the development of aural discrimination categories for vowels in English. As previous research indicates, it is likely that extra modeling and visual cues may aid in the development of vowel categories. It is possible, however, that while students watch videos for training in pronunciation they rely on the visual cues (facial movements) to help them determine the vowel. This use of visual cues, in turn, could allow students to excel in training activities without developing the ability of the ears to truly listen and use spectral cues in determining vowels.
This study aims to investigate the impact of audio vs. video training on subjects’ ability to aurally discriminate vowels. In addition, this research aims to examine student reactions to the different training delivery methods, which may affect the appeal of the exercises. Bagui (1998), for example, found that the introduction of animation, sound, and interactivity in lessons increased student motivation. One explanation of this increased motivation is that incorporating technology into training increases student autonomy, allowing them to become independent learners (Sharma & Barrett, 2007). These authors, however, were examining interactive multimedia and it is not clear whether a smaller switch, from audio to video, would also change reactions to the training.
Research Questions
The purpose of this study is to evaluate the effect of training on the discrimination of vowels, specifically, /i/ and /ɪ/ because these vowels do not contrast phonemically in many languages and often present problems for learners of English. This study aims to answer two questions:
- Will the group receiving audio pronunciation training differ from the group receiving video pronunciation training in their aural discrimination of /i/ and /ɪ/ in the post-test and delayed post-test?
- Will students find video training more appealing than audio training?
Methods
Participants
Participants included advanced ESL students enrolled in a college level ESL writing class at a large university in the United States. They were assigned to one of two groups: 30 to the video training group (80% L1 Chinese speakers and 20% mixed native languages) and 31 to the audio training group (87% L1 Chinese speakers and 13% mixed native languages). Although most of the participants were native speakers of Chinese, there were three Korean, two Arabic, one Malay, one Amharic, one Finnish, one Spanish, and one Indonesian native language speaker. Participants ranged in age from 18 to 24, with an average age of 19.67. There were 16 female participants and 41 males (four participants declined to answer that question.) The amount of English study varied widely among participants (1 year to 20 years) with an average English study length of 8.4 years. The length of time in the U.S.A. also varied from two months to eight years, with an average length of stay of approximately 11 months. The formation of groups attempted to control for these factors and the pre-test scores aimed to equalize proficiency. Table 1 illustrates the make-up of each group including averages for each group for length of time studying English, months in the U.S.A., and pre-test scores.
Table 1. Group Formation Data
| Group 1- Video Training | Group 2- Audio Training | |
| N= | 30 | 31 |
| Native Language | 80% Chinese 20% Other |
87% Chinese 13% Other |
| Gender | M= 18 F= 9 Non-report= 3 |
M= 23 F= 7 Non-report= 1 |
| Years studying English | 8.82 | 8.05 |
| Months studying in U.S.A. | 11.58 | 10.44 |
| Pre-test score | 17.53 | 17.6 |
| SD of pre-test score | 2.43 | 2.26 |
Materials
The materials used in this study included a pre-test, post-test (which was also used for the delayed post-test), audio and video training materials, a biographical data questionnaire, and a student reaction questionnaire that was administered after the rest of the study was completed. The pre-and post-test each contained twenty listening items. Participants were asked to mark their answers to questions about words:
- Are these two words the same words or different words?
- Which word of the three is different?
- Which word of the two has the “e” sound like in “feet”?
- Does this single word have the “e” sound like in “feet”?
The targeted sounds in the tests and training materials were the vowel sounds /i/ as in “feet” and /ɪ/ as in “fit”. Although /i/ exists in many languages of the world (Edwards, 1992, p. 215), /ɪ/ is less commonly found, and often presents difficulties. Nilsen and Nilsen (2002) point out that speakers from at least 31 languages are likely to encounter difficulty with this pairing because a distinction between the two sounds does not exist in the native language. Learners who may have difficulty with these sounds include speakers of Chinese, Spanish, Korean, Italian, French, and Russian (p. 1). These vowels are also valuable targets for instruction because /i/ and /ɪ/ are very common in English: /i/ is the 4th most common vowel and /ɪ/ is the second most common vowel among words in English (Edwards, 1992, pp. 215 & 221). Not only are the vowels common, but also the distinction between /i/ and /ɪ/ distinguishes many words in English, giving the pairing a high functional load (Catford, 1987, p. 88). Also, because students who received the video saw the visual cues, it was important to ensure that there were marked differences in the visual appearance of the pronunciation of each sound. For instance, /i/ is pronounced with lips spread wide, almost like a smile, whereas the lips in /ɪ/ are more relaxed and were thus a suitable pair for this study.
The researcher, who was also the source of the voice for all materials, carefully recorded each exercise to control for possible length and intonation differences. The audio files for the pre- and post-test were recorded through Audacity® software (2012). Because previous research has shown that many L2 learners will listen for length instead of spectral cues, the files were carefully checked before being exported to MP3s to ensure that the length of the word pairs or triples was within .02 seconds of each other. If the difference in length was greater than .02 seconds, the words were rerecorded. This limit was chosen partially due to practical concerns. To avoid cutting or altering the vowels with software, I chose to simply rerecord until the vowels were within the chosen limit.
The activities on the tests were specifically chosen in order to avoid an influence of spelling. By asking participants to simply make decisions about words, as opposed to simply choosing the word they heard, spelling was not involved. For that task, participants needed no knowledge about any of the target words in order to make decisions about the vowel sounds, which maintains construct validity. Also, the post-test was designed so that half of the pairs were previously unheard. In other words, the pairs were not included in the pre-test or training sessions to give a measure of the generalizability of the findings. To ensure equivalence of forms, the items from the pre-and post-test were carefully designed. Every word included in the pre-post test was a single, closed syllable. Also, attention was paid to equalize the number of vowels that would have nasalization or /r/ or /l/ coloring. To check the overall equivalency of forms, the items of the pre- and post-tests were mixed together into a single test taken by three ESL students who were not participating in the research study. The pre-test items were odds and the post-test items were evens. One ESL student scored perfectly on both the odd and even items. The other two scored 3-4 and 6-5 (with odds being listed first), suggesting that the pre- and post-test items were of similar difficulty.
For each of the two training sessions, participants watched a video (Group 1) or listened to an audio file (Group 2.) Activities in the training sessions included minimal pair activities because these types of activities have been proven to increase aural discrimination of sounds. The video was recorded on a Canon Digital SLR and edited in Microsoft Movie Maker (2012). The length of the first video was 13 minutes and 22 seconds and the second was 13 minutes and 6 seconds. To create audio files that were identical in sound and content, the audio was then stripped from the video files using a program called Video MP3 Extractor (GeoVid, 2012). These audio and video materials were provided to students for download.
The student reaction feedback questionnaire included five Likert scale items about the appeal of the training materials (The questionnaire also included two open-ended questions to allow for more individualized commentary about the training.
Procedures
The study consisted of four sessions with the participants. In Session 1, participants were given information about the study and signed a participant consent form. Then, they completed the biographical subject data questionnaire. Before subjects completed the pre-test, the volume level and sound quality was analyzed through a test file. The file was audible to all subjects in the room. In Sessions 2 and 3, the participants watched or listened to the first training file. After listening to the training in Session 3, the participants took an immediate post-test. Session 4 took place one week after the third session. In order to check the long-term effects of the training, the participants took a delayed post-test during Session 4 and then completed the student feedback questionnaire. The questionnaire was given at the end of the study because one of the open-ended questions asked participants to give their opinion about the training the other group received.
Analysis
The responses to the biographical data questionnaire were primarily used to create equivalent groups and give an indication of the generalizability of the results.
Research question 1
The pre-, post-, and delayed post-tests were used to answer the first research question, whether the groups would differ in performance due to different training. The pre- and post-tests were scored; 1 point was given for each correct answer and 0 points were given for each incorrect answer. Then an overall score was totaled and assigned. Because all subjects took all three tests, it was possible to analyze the data using a mixed ANOVA.
Exclusion of subjects from analyzed data
Some participants had to be excluded from the analyzed data for the pre-test, post-test, and delayed post-test comparisons. There were two reasons for exclusion: either a participant did not complete all four sessions of the research study, which eliminated 12 participants, or a participant received a perfect score on the pre-test. The rationale for the second exclusion possibility is that improvement due to training would not be visible in either post-test, which occurred in eight cases. This resulted in 21 participants in the audio group and 19 in the video group.
Research question 2
The student feedback questionnaire was used to address the second research question, which considers student reactions to the appeal of the training. All participants who completed the questionnaire and both training sessions were included in the analyzed questionnaire data (n=54). Reactions to the Likert scale items were scored on a 1-5 range, with 5 representing a strong agreement to the claim and a 1 representing a strong disagreement to the claim. The average score for each item was calculated for comparison. Responses to the open-ended questions were coded and examined for common themes and types of responses.
Results
Participant Improvement from Pre- to Post- Tests
Results show that both groups responded similarly to training; they both showed statistically significant improvement (p= .000) from the pre-test to the post-test with an effect size of .70. Despite a decline in the average score from the post-test to the delayed post-test, students maintained a significant improvement from the pre-test to the delayed post-test (p= .008, effect size= .39). The decrease from the post-test to the delayed post-test was not found to be statistically significant. Table 2 reports the average scores for each group at each testing time.
Table 2. Scores for Pre-, Post-, and Delayed Post-tests by Group
| Video Group | Audio Group | |||
|---|---|---|---|---|
| Average | SD | Average | SD | |
| Pre-test | 16.63 | 2.52 | 16.95 | 2.01 |
| Post-test | 18.11 | 1.85 | 18.24 | 1.55 |
| Delayed post-test | 17.47 | 3.04 | 18.00 | 2.07 |
Although the percent improvement for the audio group was slightly higher than the video group (7.27% versus 6.43%) when comparing the pre-test to post-test, this difference was not found to be statistically significant. Also, the decrease in score from the post-test to the delayed post-test for the audio group was slightly lower than for the video group as well (1.2% versus 3.2%). However, this was also found to be not statistically significant. Figure 1 shows the average score for each group on each of the three tests.
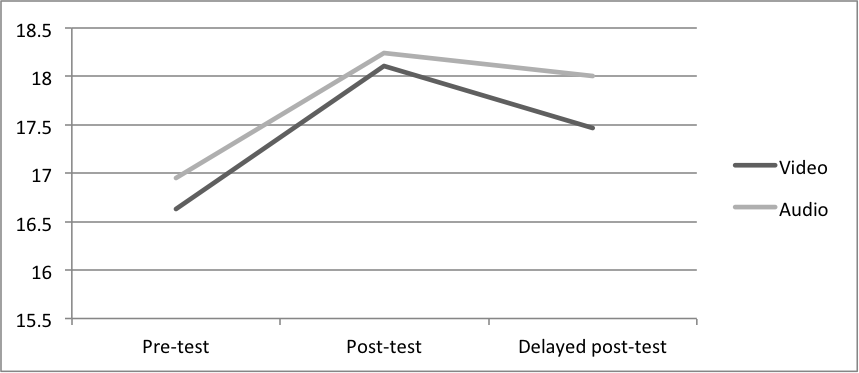
Figure 1. Scores for Pre-, Post-, and Delayed Post-tests by Group
Appeal of the Training
Overall, the video group provided higher scores for every item in the questionnaire. Responses from the two groups differed most in response to the claim, “I would like to do more training like this.” The average score given by the video group was 0.8 points higher than the audio group. The smallest difference between the groups was found in response to the claim: “The instructions for each activity were clear.” in which the video group gave an average score only 0.12 points higher than the audio group. Table 3 shows the five claims presented to students and the average score given for each item.
Table 3. Scores to Likert Scale Questionnaire Items by Group
| Video Group | Audio Group | |||
|---|---|---|---|---|
| Average | SD | Average | SD | |
| The instructions for each activity were clear | 4.55 | 0.51 | 4.43 | 0.68 |
| The quality of the recordings was high | 4.50 | 0.51 | 4.00 | 0.95 |
| I feel that my ability to hear vowel differences has improved | 3.75 | 0.55 | 3.57 | 0.75 |
| I feel the training was interesting | 3.55 | 0.76 | 3.38 | 0.74 |
| I would like to do more training like this | 3.85 | 0.81 | 3.05 | 1.20 |
The two usability questions about the clarity of instructions and recording quality were given higher scores and the other two appeal scores about the training being interesting and the ability to hear vowels after training were given lower scores. For the audio group question, however, this item received the lowest score. This relationship can be better illustrated in Figure 2.
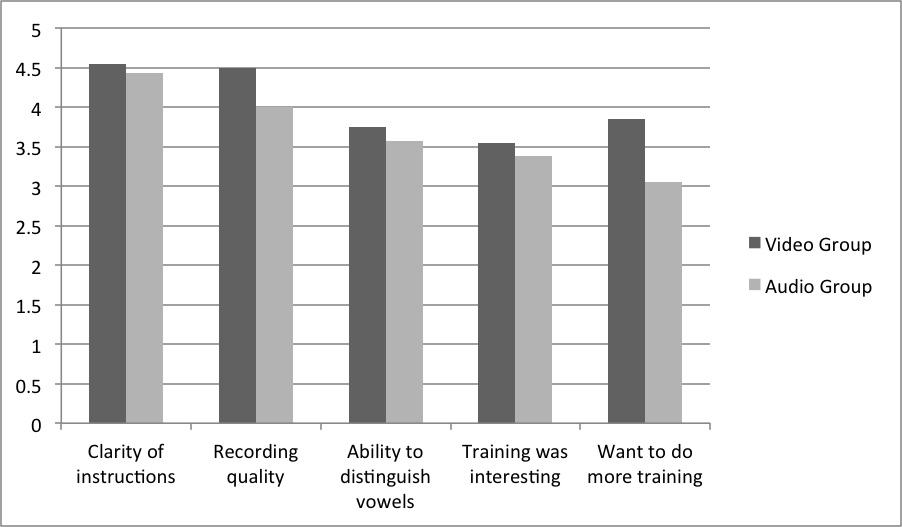
Figure 2. Scores to Likert Scale Questionnaire Items by Group
In response to the open-ended question, only five of the video group thought that the audio would have been better. In contrast, 12 members of the audio group thought that video would have been better. Only eight members of the audio group thought that the video would be worse, whereas 13 members of the video group thought that the audio would be worse. Ten members of the video group responded that they were not sure, gave unclear answers, or said they thought the two delivery methods were equal. This also happened in six cases in the audio group.
Of the participants that thought video was better, 12 indicated that seeing the mouth movements was helpful for understanding how the sounds were made. One participant wrote, “I think would’ve been worse. I could learn how lips are different when pronounce different vowels through video.” Interestingly, one participant even made a comment similar to the dual processing theory. He said, “[Video is better] because they use two senses to gain the knowledge.” This utilization of visual cues was also mentioned as a limitation by the participants who thought audio would be more useful. Three participants mentioned that because they could get the answers by looking at the different visual cues, audio would be better training. Four other participants answered more generally that because the goal was to improve listening, audio would be better. One participant said, “[Video is] worse. This activity is focus on listening. The audio is focus on listening. The video might make people focus on the screen.” Also, two participants specifically mentioned that they thought the video would be distracting.
Although most of the participants responded to the question of which medium is better in terms of improvement four participants responded in terms of appeal. They stated that the video would be better because it is more interesting (two from each group). One participant stated, “I think video must be more interesting and attractive than just audio files.”
In response to the question, “How do you think this training could be improved?” the most common response was that the training needed more difficult items and activities (six for video group and seven for audio group). Also, the next most common comment for each group was that the training needed more items and questions. Interestingly, although in the previous question, four people indicated that the video would be more interesting, more people in the video group indicated that the training could be improved by making it more interesting. Another interesting finding was that two members of the audio group wanted clearer directions, but none of the video group members indicated this. Finally, one member from each group indicated that they wanted personalized feedback from the training.
Discussion
This study produced three main findings. First, similar to the numerous previous research studies (such as Bradlow, Pisoni, Yamada, & Tohkura, 1997 and Logan, Lively, & Pisoni, 1991) this study found significant improvement due to training with discrimination tasks. Despite the fact that none of the participants were observed re-listening or re-watching parts of the training and despite the fact that they received no personalized feedback, students were able to improve. For teachers, this means that these listening activities can be done outside of class as homework and class time can be utilized more efficiently.
More importantly, however, in contrast to previous research (Hardison, 2003; Hardison, 2005; Hirata & Kelly, 2010) the introduction of video versus audio seems to have made little to no difference. This finding does not support the information processing theory, which claims that audio plus video would allow for dual coding and better storing and accessing of new information (Bagui, 1998; Treichler, 1967). Instead, it seems that the audio group, which only had available one route to store and access information, slightly outperformed the video group. They made slightly higher improvements on the post-test and less improvement on the delayed post-test. This may indicate that subjects receiving video training do rely on facial gestures for making decisions about words (similar to MacDonald and McGurk, 1978), therein inhibiting their development of aural discrimination categories. As previously mentioned, however, the differences between the audio and video group were not found to be statistically significant. For teachers, this means that training for English vowels can be done through either method. For most teachers, audio recording, which can be done with free software such as Audacity, will be less time consuming and less expensive.
Finally, although the two training types produced similar results in terms of participant improvement, reactions were generally more favorable to the video training. This finding supports previous research that has shown that the use of multimedia can increase student motivation (Bagui, 1998; Sharma & Barrett, 2007). It seems that the change from audio to video can also produce changes in attitudes and reactions towards training. For teachers, this would suggest that by incorporating video into instruction (at least occasionally) teachers may be able to offset feelings of monotony and increase student interest.
Nonetheless, it is important that all findings be considered in light of the numerous limitations of this study. One of the main problems encountered with this study was the ceiling effect caused by numerous high scores on the pre-test. Over 75% of the original 61 participants scored a 17 or higher on the pre-test (out of a possible 20). This left little room for visible improvement. It may be possible that, with a more sensitive pre-test, differences could have been found.
Another limitation was the time on task for the training. Because the activities were repetitive, the length of each training recording was quite short, lasting approximately 13 minutes for each recording. By incorporating more training activities and more training time, it is possible that differences could have been found. Also, although this study began with 61 participants, data from 20 participants could not be used to analyze improvement from the pre-test to the two post-tests. With only 41 subjects, the generalizability of the results is somewhat questionable. Similar future research is necessary to confirm these findings.
Despite the limitations of this study, the results suggest that this matter of whether to use audio or video training is not conclusively decided. Future research should not only aim to replicate these findings, but also expand the scope of inquiry to include more pronunciation features. Thus far, only one English vowel pairing, /i/-/ɪ/, and one English consonant pairing, /l/-/r/, has been investigated [citation?]. Yet there are many other pairings that have clear differences in visual cues, such as /ʌ/ vs. /ɔ/ or /θ/ vs. /t/ that could add to the understanding of the impact of the visual cues.
Because there has previously been relatively little interest in this area of research, there are many possible directions to go with this type of research. Although researchers have recently started to turn their attention to the effects of audio vs. video training for teaching pronunciation, many questions are left unanswered. As teachers are already employing these modes of delivery in their classrooms and as homework, it is important that further research be conducted to determine the effects of these two methods of training delivery.
About the Author
Shannon McCrocklin is a doctoral student in Applied Linguistics and Technology at Iowa State University. She holds an MA from University of Illinois in Teaching English as a Second Language. Her primary research interest focuses on pronunciation instruction.
References
Audacity®. (2012). [software; open-source] http://audacity.sourceforge.net.
Bagui, S. (1998). Reasons for increased learning using multimedia. Journal of Educational Multimedia and Hypermedia, 7, 3-18.
Banafa, F.H. (2008). Effects of IT on pronunciation: Impact of the Internet and interactive multimedia on English pronunciation of Arab college students studying in the United States. La Vergne, TN: Lightning Source, Inc.
Beddor, P.S., & Strange, W. (1982). Cross-language study of perception of the oral-nasal distinction. Journal of the Acoustical Society of America, 71, 1551-1561.
Blankenship, B. (1991). Second language vowel perception. Journal of the Acoustical Society of America, 90, 2252.
Bohn, O.S., & Flege, J.E. (1990). Interlingual identification and the role of foreign language experience in L2 vowel perception. Applied Psycholinguistics, 11, 303-328.
Bradlow, A. (1997). Training Japanese listeners to identify English /r/ and /l/. Journal of the Acoustical Society of America, 101, 2299-2310.
Bradlow, A., Pisoni, D., Yamada, R., & Tohkura, Y. (1997). Effects of audio-visual training on the identification of English /r/ and /l/ by Japanese speakers. Journal of the Acoustical Society of America, 102, 3137.
Calvert, G.A., Bullmore, E.T., Brammer, M.J., Cambell, R., Williams, S., McGuire, P.K., & David, A.S. (1997). Activation of auditory cortex during silent lipreading. Science, 276 (5312), 593-596.
Catford, J.C. (1987). Phonetics and the teaching of pronunciation: A systematic description of English phonology. In Morley, J. (Ed.), Current perspectives on pronunciation: Practices anchored in theory (pp. 87-100). Washington, D.C.: TESOL.
Celce-Murcia, M., Brinton, D., & Goodwin, J. (2010). Teaching pronunciation: A course book and reference guide. Cambridge: Cambridge University Press.
Edwards, H. (1992). Applied phonetics: The sounds of American English. San Diego, CA: Singular Publishing Group Inc.
Engwall, O., & Balter, O. (2007). Pronunciation feedback from real and virtual language teachers. Computer Assisted Language Learning, 20, 235-262.
Flege, J.E., Munro, M.J., & Fox, R.A. (1993). Auditory and categorical affects on cross-language vowel perception. Journal of the Acoustical Society of America, 95, 3623-3641.
Dalton, C., & Seidlhofer, B. (1994). Pronunciation. Oxford: Oxford University Press.
Grant, L. (1993). Well said: Advanced English pronunciation. Boston, MA: Heinle & Heinle Publishers.
Hardison, D. M. (2003). Acquisition of second language speech: Effects of visual cues, context, and talker variability. Applied Psycholinguistics, 24, 495-522.
Hardison, D. M. (2005). Second language spoken word identification: Effects of training, visual cues, and phonetic environment. Applied Psycholinguistics. 26, 579-596.
Hincks, R., & Edlund, J. (2009). Promoting increased pitch variation in oral presentations with transient visual feedback. Language Learning and Technology, 13, 32-50.
Hirata, Y., & Kelly, S.D. (2010). Effects of lips and hands on auditory learning of second-language speech sounds. Journal of Speech, Language, and Hearing Research, 53, 298-310.
Levis, J., & Pickering, L. (2004). Teaching intonation in discourse using speech visualization technology. System, 32, 505-524.
Logan, J., Lively, S., & Pisoni, D. (1991). Training Japanese listeners to identify English /r/ and /l/: A first report. Journal of the Acoustical Society of America, 89, 874-886.
MacCarthy, P. (1976) Auditory and articulatory training for the language teacher and learner. English Language Teaching Journal, 3, 212-219.
MacDonald, J., & McGurk, H. (1978). Visual influences on speech perception processes. Perception & Psychophysics, 3, 253-257.
McClaskey, C., Pisoni, D., & Carell, T. (1983). Transfer of training of a new linguistic contrast in voicing. Perception & Psychophysics, 34(4), 323-330.
Morrison, G. S. (2008). L1-Spanish speakers’ acquisition of the English /i/–/ɪ/ contrast: Duration-based perception is not the initial developmental stage. Language & Speech, 51, 285–315.
Movie Maker. (2012). [software] Microsoft Corporation.
Neri, A., Cucchiarini, C., & Strik, H. (2008). The effectiveness of computer-based speech corrective feedback for improving segmental quality in L2 Dutch. ReCALL, 20, 225-243.
Nilsen, D., & Nilsen, A.P. (2002). Pronunciation contrasts in English. Prospect Heights, IL: Waveland Press, Inc.
Pisoni, D., Aslin, R., Perey, A., & Hennessey, B. (1982). Some effects of laboratory training on identification and discrimination of voicing contrasts in stop consonants. Journal of Experimental Psychology: Human Perception and Performance, 8(2), 297-314.
Rochet, B. (1995). Perception and production of second-language speech sounds by adults. In W. Strange (Ed.), Speech perception and linguistic experience: Issues in cross-language research (pp. 379-410). Timonium, MD: York Press, Inc.
Rvachew, S. (1994). Speech perception training can facilitate sound production learning. Journal of Speech and Hearing Research, 37, 347-357.
Sharma, P., & Barrett, B. (2007). Blended learning: Using technology in and beyond the language classroom. Oxford: Macmillan Publishers Limited.
Strange, W., & Dittmann, S. (1984) Effects of discrimination training on the perception of /r-l/ by Japanese adults learning English. Perception and Psychophysics, 36(2), 131-145.
Treichler, D.G. (1967). Are you missing the boat in training aid? Film and A-V Communication, 1, 14-16.
Video MP3 Extractor. (2012). GeoVid. http://www.geovid.com/video_mp3_extractor/.
Wang, X., & Munro, M. (2004). Computer-based training for learning English vowel contrasts. System, 32, 539-552.
| © Copyright rests with authors. Please cite TESL-EJ appropriately. Editor’s Note: The HTML version contains no page numbers. Please use the PDF version of this article for citations. |